Earlier this month, the Intergovernmental Panel on Climate Change (part of the United Nations) released a report that sheds light on just how severe the climate crisis has become.
The report is one of the most precise and extensive we’ve seen yet, as it’s based on the analysis of over 14,000 other studies. Along with concluding that global warming will continue until at least 2050, no matter what actions we take now, the report also shares that other severe environmental impacts will continue even beyond that. Mainly, global sea levels will continue to rise for at least 2,000 years.
The question now is: at what speed and at what level of devastation? That all depends on conditions over the following decades, and if the plan set out in the Paris Accords is followed or if global warming continues to drastically increase.
A 2020 study utilizing the projections of over 100 international field experts stated:
In a scenario where global warming is limited to 2 degree Celsius above pre-industrial levels, the experts estimated a rise of 0.5 meters by 2100 and 0.5 to 2 meters by 2300. In a high-emissions scenario with 4.5 degree Celsius of warming, the experts estimated a larger rise of 0.6 to 1.3 meters by 2100 and 1.7 to 5.6 meters by 2300.
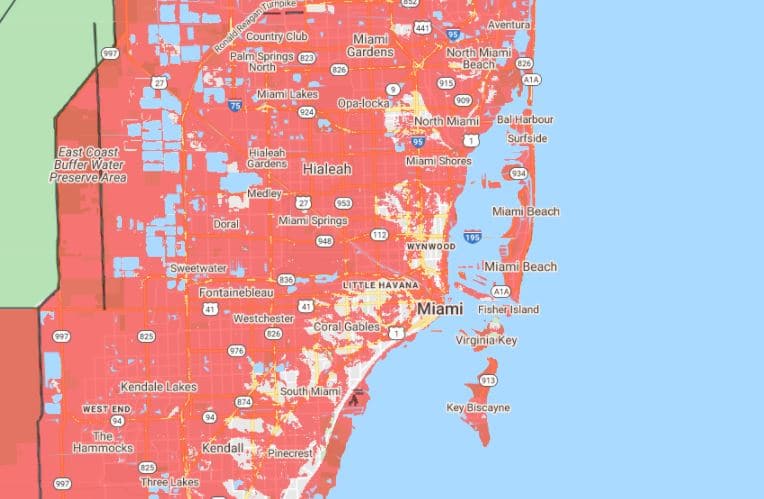
The website Climate Central allows users to simulate these scenarios, and see what it would look like on your local map if water levels rose through a combination of sea-level rise, tides, and storm surge. It gives you the option to view in meters or feet; you can try out the tool for yourself here. As seen on the maps of Miami below, due to the city’s low-lying topography, porous limestone, dense coastal development and encroaching seas the whole of the greater Miami area would be severely (if not absolutely) damaged by a sea level rise of 3 meters.
Miami if the water level rose to 1 meter.

Miami if the water level rose 2 meters.

Miami if the water level rose 3 meters.

Meanwhile, another of Climate Central’s maps will let users determine what the likeliest scenarios (from best to worse) for what Miami would look like with a rise in sea levels starting in 2030 while also taking into account other phenomenons such as annual flooding and pollution. And while this map gives a more hopeful panorama of the Magic City, it still shows how severely affected coastal areas below sea level such as Miami Beach would be if annual floodings keep increasing and the city’s levels of pollution are left unchecked.
Miami by 2030: Best case scenario

Miami by 2030: Worst case scenario

Miami by 2070: Best case scenario

Miami by 2070: Worst case scenario


